
Overview
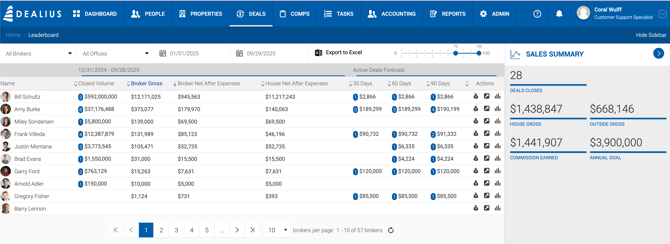
The Leaderboard page opens when clicking the Show Details arrow or any broker row on the Leaderboard dashboard widget. It displays performance statistics for top brokers and can be exported to Excel with all applied filters respected.
Filters
| Filter | Description |
|---|---|
| Brokers | Filter by one or more brokers. |
| Offices | Filter by one or more offices. |
| Date Range | Filters by payable paid date. Defaults to YTD. Displays "Year-to-Date" when default is active; switches to the selected date range format (e.g., 01/01/2026 – 12/31/2026) when a custom range is chosen. |
| Probability | Filter by deal probability. |
YTD Columns
| Column | Description |
|---|---|
| Closed Volume | Total deal value for all deals YTD based on paid payables. The blue circle shows the number of deals. Clicking redirects to Deals > Cash Flow, filtered by the selected broker, closed deals, Broker Paid filter, and YTD period. |
| Broker Gross | Total YTD Broker Gross for the individual broker based on paid payables. |
| House Net After Expenses | Shows the original House Net value before expense deductions. |
| Broker Net After Expenses | Shows the original Broker Net value before expense deductions. |
Note: For leasing volume specifically, the system counts deal volume in the year the first payment was paid.
Active Deals Forecast
| Column | Description |
|---|---|
| 30 Days | Total Broker Gross for deals closing within the next 30 days. |
| 60 Days | Total Broker Gross for deals closing within the next 60 days. |
| 90 Days | Total Broker Gross for deals closing within the next 90 days. |
The blue circle on each cell shows the number of deals composing the amount. Clicking any forecast value redirects to Deals > Pipeline, filtered by Active (with 70% probability or higher) and Pending deals, the selected broker, the same probability, and the corresponding time window (30, 60, or 90 days).
Actions
| Action | Description |
|---|---|
| Export Earnings History Report | Exports the earnings history report respecting the current Leaderboard filters. |
| Active Deals | Navigates to the Active Deals page. |
| Agent Profile | Opens the Agent Production Overview for the selected broker. |
Sidebar
The sidebar displays summary metrics based on the applied date range for closed deals. Values reflect all active and inactive brokers whose deals closed within the selected period — not just the brokers currently displayed in the grid.
For example, House Gross in the sidebar represents the total House Gross from all deals closed within the selected date range across all brokers.