
Overview
This report provides a breakdown of broker gross commissions — both paid and open — for the selected fiscal year, along with four years of historical data for comparison. Total deal values are not included.
| Filter | Description |
|---|---|
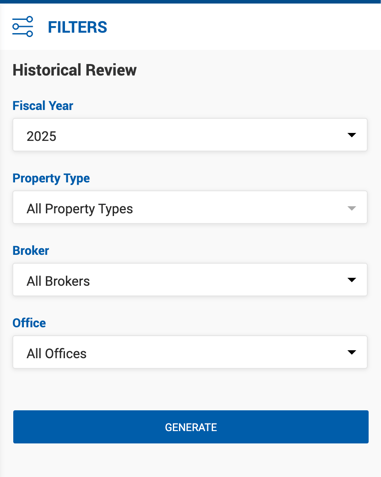
| Fiscal Year | Single-select dropdown covering years based on invoice Paid Date. Required. |
| Property Type | Multi-select dropdown of all property types in the system. |
| Brokers | Multi-select dropdown of all active and inactive internal brokers, with options to select All Active Brokers and/or All Inactive Brokers. |
| Office | Multi-select dropdown of offices, filtered based on the selected brokers. |
Report Columns
| Column | Description |
|---|---|
| Broker Full Name | The broker's full name. |
| Primary Specialty | Pulled from the Primary Specialty field on the Broker Profile. |
| Hire Date | Pulled from the Hire Date field on the Broker Profile. |
| Paid Broker Gross | Broker gross for paid receivables in the selected FY. |
| Open Broker Gross | Outstanding broker gross for open receivables in the selected FY. |
| FY Annual Goal | Static value from the Broker Profile for the selected FY. Displays N/A if no goal has been entered. |
| % of Goal | Formula: (Paid Broker Gross + Open Broker Gross) ÷ FY Annual Goal × 100. Displays N/A if no annual goal is set. Pulled from Admin > Brokers > Broker Profile > Production Goals > Gross Commission for the selected FY. |
| Four Years Average | Average broker gross across the four prior fiscal years. Formula: (FY−1 + FY−2 + FY−3 + FY−4) ÷ 4. |
| FY−1 | Broker gross from paid receivables in the fiscal year preceding the selected FY. |
| FY−2 | Broker gross from paid receivables two fiscal years prior. |
| FY−3 | Broker gross from paid receivables three fiscal years prior. |
| FY−4 | Broker gross from paid receivables four fiscal years prior. |