
Overview
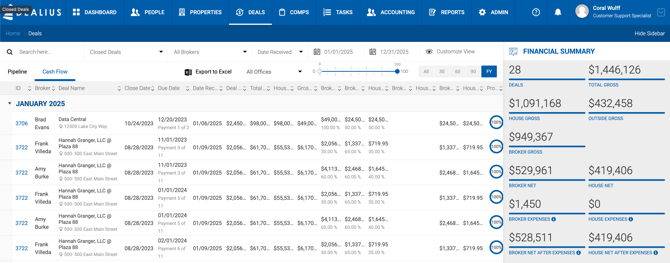
The Cash Flow tab on the Deals page displays payment data grouped by month, with one row per payment per broker. Each payment is linked to a deal and includes all associated deal data such as client information, property details, and commission splits. Month sections can be collapsed or expanded as needed and load via lazy loading as you scroll.
The right sidebar displays a Financial Summary showing real-time totals for the current filtered view, including: Deals, Total Gross, House Gross, Outside Gross, Broker Gross, Broker Net, Broker Expenses, House Expenses, Broker Net After Expenses, and House Net After Expenses.
Filters
- Deal Status (e.g., Closed Deals)
- Broker
- Date Received — From / To date range
- All Offices
- Probability Slider
- 30 / 60 / 90 / FY toggles
- Customize View
Column Definitions
| Column | Description |
|---|---|
| Broker | The broker receiving the payment. Each row represents one broker. |
| Deal Name | Name of the deal and property address. |
| Close Date | Actual close date of the deal. |
| Due Date | Payment due date. |
| Date Rec. | The actual date the payment was received on the Receivables side. |
| Deal Value | Total transaction value from the Deal Profile. |
| Total Gross | Total commission to be paid to the firm across all payments for the deal. |
| House Gross | Total commission received by the House, excluding outside broker fees — unless House Paid = Yes, in which case outside broker fees are included. |
| Gross Payment | Amount invoiced for this payment until the receivable is paid. Includes Sales Tax if applicable. |
| Broker Gross | Dollar amount going to the broker before the house split. The percentage reflects the broker's share of the deal relative to all other brokers. |
| Broker Net (My Net) | Broker's earnings after all splits, before expense deductions. The percentage reflects the agreed split with the house. |
| House Net | House earnings after the broker split, before expense deductions. |
| Broker Expenses (My Expenses) | Sum of broker expenses per broker per payment. |
| House Expenses | Sum of house expenses per broker per payment. |
| Broker Net After Expenses (My Net After Expenses) | Broker Net minus Broker Expenses. Once expenses are paid on the Payable screen, this reflects the actual net value. |
| House Net After Expenses | House Net minus Broker Expenses. |
| Probability | Displayed for payments on active deals only. |
Totals
- Monthly Total — Sum of Broker Gross, Broker Split, House Split, Broker Expenses, House Expenses, Broker Net After Expenses, and House Net After Expenses for the month.
- Running Total — Cumulative sum of all monthly totals from the beginning of the displayed data through the current month.
Export to Excel
The Export to Excel option exports the full Cash Flow grid with applied filters as a single flat table with no month groupings. In addition to the columns visible in the UI, the export includes:
- Property Submarket
- Portfolio (Yes / No)
- Tax ID
- Agent Tax Type (Employee, Contractor, or House)
- Broker Account Number — determined by the Portfolio flag:
- Portfolio = Yes — Shows the broker's Portfolio Account Number.
- Portfolio = No — Shows the broker's Third-Party Account Number.