
Overview
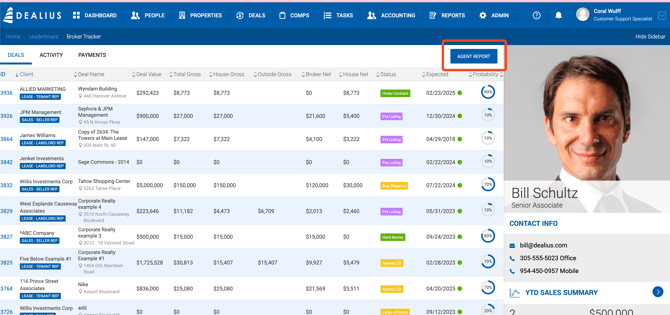
The Agent Production Overview can be accessed from the Leaderboard grid by clicking on a broker, or directly by brokers from the Tracker section. It provides a comprehensive snapshot of production performance including rankings, earnings trends, and monthly breakdowns.
Agent Profile
| Field | Description |
|---|---|
| Name & Title | Broker's full name and title. |
| Profile Image | Broker's profile photo. |
| Office Name | The office where the broker has the highest number of deals. |
| Office Ranking | Broker's rank by YTD Broker Gross within their office, based on closed deals. |
| Company Ranking | Broker's rank by YTD Broker Gross across all brokers in the system, based on closed deals. |
| Deals Closed YTD | Total number of closed deals the broker has participated in year to date. |
| Average Split | Average broker split based on receivables paid YTD. |
| Social Networks | LinkedIn and Twitter links, displayed only if configured in the Admin panel. |
Broker Gross — Start Year to Present
A bar chart showing broker gross from the broker's start year to the current year, broken out into three deal type categories: Sales, Leases, and Other. Hover over bars for detailed figures.
Previous Year to Date Comparison
A table comparing broker gross across transaction types year over year:
| Column | Description |
|---|---|
| Transaction Type | Sales, Leases, Other, and Total. |
| Prior Year | Full-year Broker Gross for the previous fiscal year. |
| YTD Current Year | Broker Gross from the start of the current FY to today. |
| Percentage | Indicates the year-over-year change trend between YTD prior year and YTD current year. |
| Total | Combined total across all transaction types. |
12 Month Earnings
An interactive line chart displaying Broker Gross and Broker Net across the last 12 months. Hover over data points to see detailed figures.
12 Month Earnings Breakdown
A table listing Broker Gross and Broker Net for each of the last 12 months individually.